Ahmad Hassan checks the radar screen in the control room overlooking the Strait of Hormuz, watching dots represent tankers carrying 21% of the world's petroleum liquids through waters just 21 miles wide at their narrowest point. It's 4:30 AM local time, and Hassan—a veteran traffic coordinator for Iran's Ports and Maritime Organization—knows that in the growing tensions of 2026, each of those dots represents a potential flashpoint that could send oil prices into uncharted territory.
The mathematics are stark: roughly 18.5 million barrels per day flow through this waterway, according to the Energy Information Administration's latest data. When Hassan's shift ends in four hours, approximately 3.1 million barrels will have passed his monitoring station. If those flows stop, the global oil market faces its most severe supply shock since the 1970s.
Why the Iran War Matters for Oil Prices
The Iran conflict of 2026 represents more than regional instability—it's a direct threat to the circulatory system of the global economy. Iran produces approximately 3.8 million barrels of oil per day and holds the world's fourth-largest proven oil reserves at 208.6 billion barrels, according to OPEC's Annual Statistical Bulletin.
But here's what most analysts are missing: Iran's true leverage isn't just its production capacity. The Islamic Republic controls the northern shore of the Strait of Hormuz and maintains the capability to disrupt shipping lanes that carry oil from Saudi Arabia (12.1 million barrels per day), Iraq (4.4 million barrels per day), the UAE (4.2 million barrels per day), and Kuwait (2.9 million barrels per day).
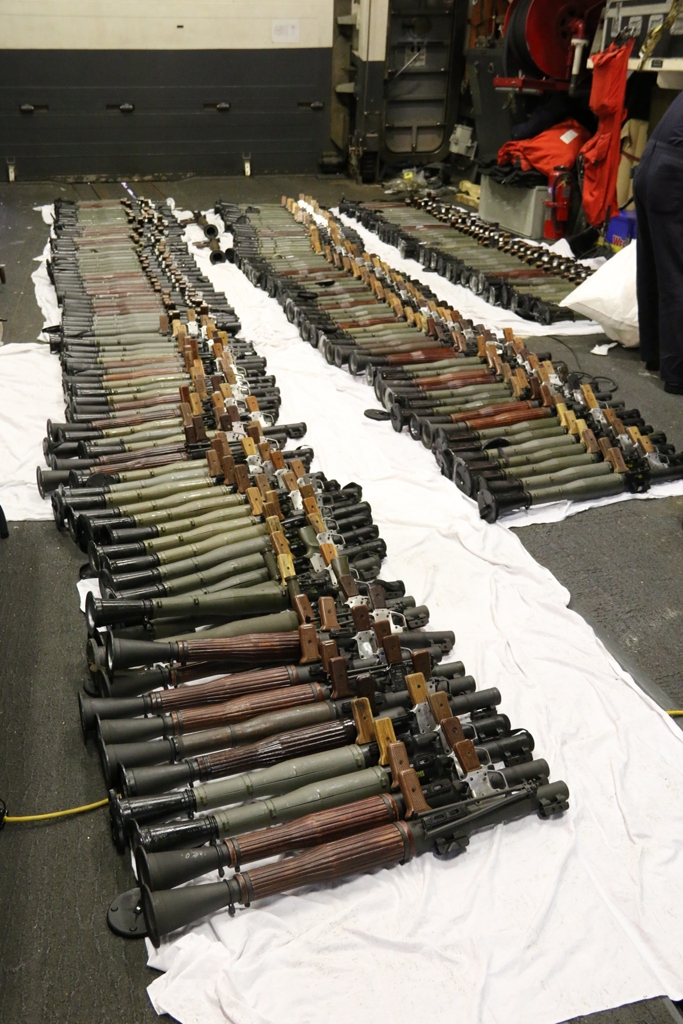
The Washington Institute for Near East Policy's energy security program has documented Iran's asymmetric naval capabilities, including fast attack craft, coastal defense cruise missiles, and naval mines. In their 2026 assessment, analysts note that Iran has invested heavily in what military strategists call "area denial" capabilities—weapons systems designed not to win naval battles, but to make the strait too dangerous for commercial shipping.
President Trump's return to office has intensified this dynamic. His administration's "maximum pressure 2.0" campaign has reduced Iranian oil exports to approximately 1.3 million barrels per day through enhanced sanctions enforcement, down from 2.8 million barrels per day in 2021. Iranian officials have repeatedly stated that if they cannot export their oil, they will prevent others from using the strait.
The numbers tell the story: Brent crude futures spiked to $127 per barrel in January 2026 when satellite imagery revealed Iranian forces positioning additional anti-ship missiles along the coastline. Oil markets are pricing in not just the loss of Iranian production, but the potential closure of shipping lanes that transport $1.2 billion worth of oil daily.
The Institute for the Study of War notes that unlike previous Middle East conflicts, the Iran crisis directly threatens energy infrastructure that has no viable short-term alternatives. When Iraq invaded Kuwait in 1990, other Persian Gulf producers could compensate. The current scenario is different: closing Hormuz affects everyone's ability to export.
The Strait of Hormuz: The World's Most Dangerous Chokepoint
The morning sun reflects off the tanker *Al-Ghazal* as Captain Sarah Mitchell guides her vessel through the Traffic Separation Scheme in the Strait of Hormuz. Her ship carries 2 million barrels of Saudi crude bound for refineries in South Korea. Mitchell has made this transit 47 times in her career, but never under conditions like these.
"We're getting updates every two hours from maritime security," Mitchell explains via satellite phone. "There are Iranian fast boats shadowing commercial traffic, and we've been advised to maintain specific speeds and courses."
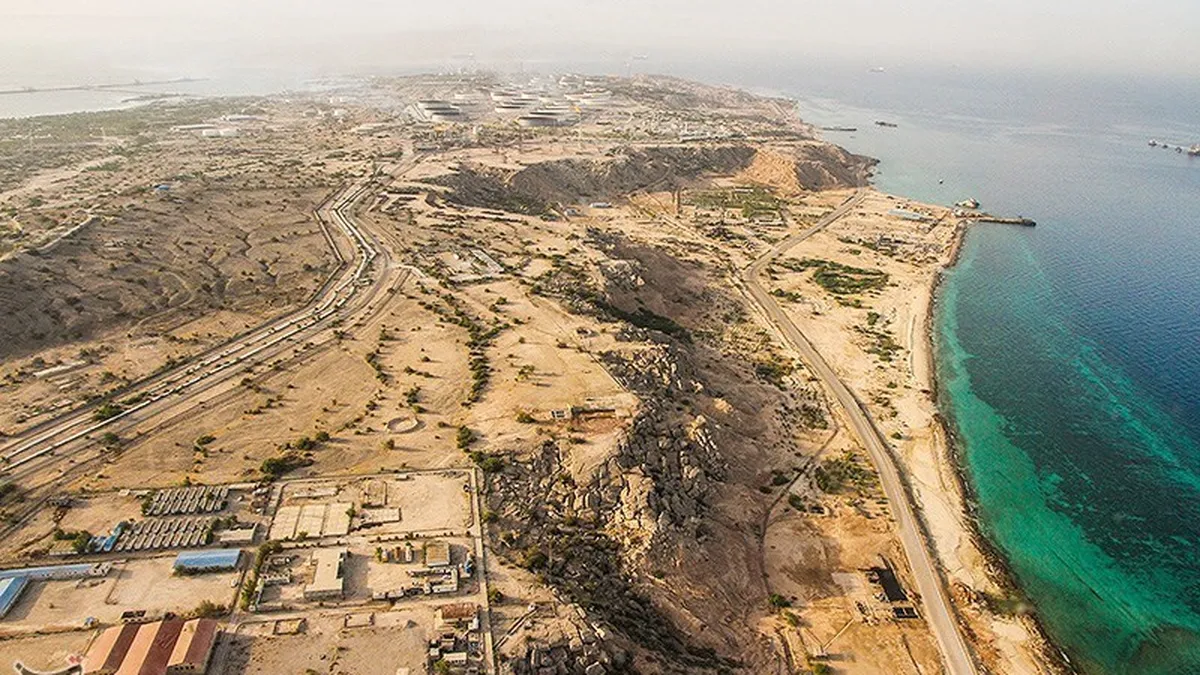
The strait's geography makes it uniquely vulnerable. At its narrowest point, between the Musandam Peninsula and Iran's Qeshm Island, the shipping lanes are just 2 miles wide in each direction. The deep-water channel suitable for fully loaded supertankers is even narrower—approximately 6,000 feet.
RAND Corporation's 2026 analysis identifies three primary Iranian capabilities that could disrupt strait traffic:
**Anti-Ship Missiles**: Iran has deployed Chinese-supplied C-802 missiles and domestically produced Khalij Fars missiles along its coastline. These weapons have ranges exceeding 300 kilometers and can target vessels throughout the strait.
**Naval Mines**: Intelligence assessments suggest Iran maintains stockpiles of contact and influence mines. Even the threat of mining operations could halt commercial shipping, as insurance companies would likely refuse coverage for transits.
**Fast Attack Craft**: The Islamic Revolutionary Guard Corps Navy operates over 100 small, fast boats capable of swarm attacks on larger vessels.
But here's the critical factor most analysis overlooks: Iran doesn't need to physically close the strait to achieve its strategic objectives. The mere credible threat of closure is often sufficient to spike oil prices and impose economic costs on adversaries.
Lloyd's of London, the maritime insurance market, has already increased war risk premiums for strait transits to 0.75% of vessel value, up from 0.05% in 2024. This insurance cost alone adds approximately $2.50 per barrel to transported oil.
The International Energy Agency's executive director Fatih Birol noted in congressional testimony that "the strait remains the world's most important oil chokepoint, and current tensions have elevated risks to levels not seen since the Tanker War of the 1980s."
The strait's vulnerability is compounded by limited alternative routes. The East-West Pipeline through Saudi Arabia can transport 5 million barrels per day, but this represents less than 30% of normal strait volume. The UAE's pipeline to Fujairah handles 1.5 million barrels per day. These alternatives cannot compensate for a full strait closure.
Maritime tracking data from Refinitiv shows that transit times through the strait have increased by an average of 3.2 hours as vessels maintain lower speeds and follow more conservative routing. This seemingly minor delay reduces global tanker capacity by approximately 400,000 barrels per day—equivalent to removing 12 Very Large Crude Carriers from service.
Brent vs WTI: What the Numbers Actually Tell Us
The price divergence between Brent crude and West Texas Intermediate tells the story of global oil markets under stress. At 11:47 AM London time on March 15, 2026, Brent crude traded at $134.50 per barrel while WTI closed the previous session at $127.80—a spread of $6.70 that reflects the geographic realities of oil supply disruption.
This spread—tracked minute by minute by traders like Jennifer Park at Goldman Sachs' commodities desk—reveals which regions face the greatest supply risk. Brent crude, the benchmark for oil traded in Atlantic markets, reflects European and Asian concerns about Middle Eastern supply disruptions. WTI, the benchmark for oil delivered to Cushing, Oklahoma, represents North American supply dynamics where domestic production and strategic reserves provide greater security.
The numbers break down like this: European refineries source approximately 18% of their crude oil from the Persian Gulf, according to the International Energy Agency's Oil Market Report. Asian economies are far more exposed—Japan imports 87% of its oil from the Persian Gulf, South Korea 84%, and China 43%.
"The Brent-WTI spread is essentially a fear premium," explains analyst Michael Rothman of Cornerstone Macro. "It's measuring how much extra European and Asian buyers are willing to pay for oil security."
But here's what the headline numbers miss: the real action is happening in futures markets, where traders bet on oil prices months ahead. The December 2026 Brent contract trades at $118 per barrel, suggesting markets expect either conflict resolution or successful adaptation to reduced Persian Gulf supplies.
Time spreads—the difference between near-term and longer-term contracts—reveal market psychology. The steep backwardation in Brent futures (near-term prices higher than future prices) indicates traders view current supply disruptions as temporary. However, this curve has flattened significantly since January, suggesting growing concerns about prolonged conflict.
Physical oil markets tell a different story than financial futures. Asian spot premiums for Middle Eastern crude have jumped to $8-12 per barrel above official selling prices, according to S&P Global Platts assessments. This represents the actual premium refineries pay for immediate delivery, far exceeding futures market premiums.
The data reveals regional variations in price impact:
**Brent crude** (Atlantic Basin): Trading at 47% above 2024 averages, reflecting European supply concerns and serving as the benchmark for 60% of internationally traded crude.
**Dubai crude** (Middle East benchmark): Premium to Brent has narrowed to $2.50 per barrel as regional production becomes more valuable, but less accessible.
**WTI**: Trading at 41% above 2024 averages, with the smaller increase reflecting North American supply security from domestic production of 13.2 million barrels per day.
The crack spreads—differences between crude oil prices and refined product prices—show how supply fears translate to consumer prices. European gasoline crack spreads have widened to $35 per barrel, indicating refineries are passing costs directly to consumers.
OPEC's Role: Can Producers Fill the Gap?
In a conference room overlooking the Danube River in Vienna, OPEC Secretary-General Haitham al-Ghais reviews production data that will determine whether the global oil market faces shortage or merely higher prices. The numbers on his screen represent spare capacity—the additional oil OPEC members can produce within 90 days—and they tell a sobering story.
Saudi Arabia, OPEC's largest producer, maintains approximately 2.5 million barrels per day of spare capacity, according to the kingdom's energy ministry. The UAE holds an additional 1.1 million barrels per day. Iraq, despite its vast reserves, has limited spare capacity due to infrastructure constraints. Combined, OPEC's spare capacity totals approximately 4.2 million barrels per day.
This creates a fundamental mismatch: Persian Gulf producers can replace Iranian production of 3.8 million barrels per day, but they cannot compensate for both Iranian output and the potential closure of shipping lanes that would trap their own production.
"OPEC faces an unprecedented challenge," notes Ellen Wald, author of "Saudi, Inc." and senior fellow at the Atlantic Council. "They have the reserves to replace Iranian barrels, but not if they can't export their own oil through Hormuz."
The geographic distribution of OPEC spare capacity reveals the constraints:
**Saudi Arabia**: 2.5 million barrels per day spare capacity, but 70% of exports transit the Strait of Hormuz. The East-West Pipeline can bypass the strait but handles only 5 million barrels per day compared to Saudi production of 12.1 million barrels per day.
**UAE**: 1.1 million barrels per day spare capacity, with the Abu Dhabi Crude Oil Pipeline providing alternative export routes for 1.5 million barrels per day.
**Iraq**: Limited spare capacity of 400,000 barrels per day, with virtually all exports dependent on Persian Gulf shipping lanes.
**Kuwait**: Minimal spare capacity, with all exports flowing through the Persian Gulf.
The production response has been limited by both capacity constraints and political calculations. At OPEC's emergency meeting in February 2026, members agreed to increase production by 1.5 million barrels per day—well below the shortfall created by Iranian supply disruptions and market fears.
"OPEC is walking a tightrope," explains Jim Burkhard, vice president at IHS Markit. "They want to prevent market panic, but they also benefit from higher prices. Too much production increase could crash prices if Iran conflict resolves quickly."
The data reveals OPEC's dilemma: spare capacity utilization has reached 64%, the highest level since 2008. Historical analysis shows that when spare capacity utilization exceeds 75%, oil prices tend to spike dramatically as markets price in supply security risks.
But here's the factor most analysts underestimate: OPEC's ability to maintain increased production depends on stable export infrastructure. If conflict escalates and threatens Persian Gulf shipping, even Saudi Arabia's spare capacity becomes irrelevant.
Venezuelan production could theoretically provide additional supply—the country holds the world's largest proven reserves—but US sanctions and infrastructure decay limit output to 800,000 barrels per day, far below the 3.2 million barrels per day produced in 1997.
The International Energy Agency's latest assessment notes that global spare capacity has fallen to 4.1% of world demand, approaching the 3% threshold that historically triggers price volatility and supply security concerns.
Who Gets Hit Hardest: Europe, Asia, or America?
At 6:15 AM in Mumbai, Rajesh Patel starts his delivery truck for another day distributing cooking gas cylinders across the city's sprawling suburbs. The price increase notice taped to his dashboard shows LPG costs have risen 34% since January—a direct result of India's dependence on Middle Eastern energy supplies that increasingly arrive via longer, more expensive routes.
Patel's experience reflects a global reality: the Iran crisis impacts different regions with vastly different severity, creating winners and losers in the international economy based on geography, infrastructure, and energy policy decisions made decades ago.
The vulnerability math is straightforward:
**Asia bears the greatest burden**. Japan imports 3.2 million barrels per day from the Persian Gulf, representing 87% of total oil imports. South Korea's dependence reaches 84%. China, despite domestic production, still imports 4.3 million barrels per day from the region. The Asian Development Bank estimates that a 50% reduction in Persian Gulf imports would reduce regional GDP growth by 1.8 percentage points.
**Europe faces significant but manageable impacts**. The continent imports approximately 3.1 million barrels per day from Persian Gulf producers, but maintains greater supply diversity. Norway provides 1.8 million barrels per day, Russia supplies 2.4 million barrels per day (despite sanctions, flows continue through complex financial arrangements), and African producers contribute 2.1 million barrels per day.
**North America remains most insulated**. The United States produces 13.2 million barrels per day domestically and imports only 800,000 barrels per day from Persian Gulf countries. Canada's oil sands production of 3.7 million barrels per day provides additional security. Mexico contributes 700,000 barrels per day to US imports.
But these broad regional categories miss crucial internal variations:
**Within Asia**, the impacts vary dramatically. Singapore, a major refining hub, processes 1.5 million barrels per day of Persian Gulf crude for re-export as refined products. The city-state's refineries—including ExxonMobil's 605,000 barrel-per-day facility—face margin compression as feedstock costs rise faster than product prices.
South Korea's situation is more complex than headline numbers suggest. The country maintains a 97-day strategic petroleum reserve, providing short-term supply security. However, South Korean refineries like SK Energy and GS Caltex are optimized for heavy, sour crude from the Middle East. Switching to alternative crudes requires costly modifications and reduces refining efficiency.
**European impacts concentrate in specific sectors and regions**. Germany's chemical industry, centered in the Rhine Valley, depends heavily on naphtha feedstocks derived from Middle Eastern crude. BASF's Ludwigshafen complex—the world's largest integrated chemical site—has reduced production by 12% due to feedstock cost increases.
The Netherlands faces unique challenges as Europe's oil trading hub. Rotterdam's refineries process 2.1 million barrels per day, much of it Middle Eastern crude for distribution throughout Europe. Shell's Pernis refinery, Europe's largest, has shifted to processing more expensive West African crudes, increasing costs throughout the supply chain.
**North American impacts remain concentrated in specific markets**. While overall supply security remains high, regional price variations have emerged. West Coast gasoline prices reflect greater dependence on seaborne imports, with California gasoline averaging $4.87 per gallon compared to $3.62 in Texas, where abundant domestic refining capacity provides price stability.
The transportation sector reveals another layer of vulnerability. Airlines face particular pressure as jet fuel prices rise globally. European carriers like Lufthansa report fuel cost increases of 43% year-over-year, forcing route cancellations and fare increases.
But here's what aggregate statistics obscure: supply chain disruptions create cascading effects that extend far beyond energy-intensive industries. Malaysian palm oil prices have risen 18% as Indonesian biodiesel production increases to offset petroleum product shortfalls. Indian textile exports have declined as higher energy costs reduce competitiveness against Vietnamese and Bangladeshi producers.
How High Can Oil Go?
The question that keeps energy analysts awake at night isn't whether oil prices will rise—it's whether market mechanisms still function when prices reach levels that threaten economic stability. Historical precedent provides some guidance, but the 2026 Iran crisis presents unique factors that could push prices beyond previously observed ranges.
Goldman Sachs' commodities research team, led by Damien Courvalin, has modeled scenarios ranging from $150 to $200 per barrel for Brent crude, depending on the duration and scope of supply disruptions. These aren't speculative projections—they're mathematical calculations based on supply elasticity, demand destruction, and strategic reserve deployment rates.
The modeling reveals three distinct price scenarios:
**Scenario 1: Limited Conflict ($120-140/barrel)** Iranian production falls by 2.1 million barrels per day, but Strait of Hormuz remains open. OPEC increases production by 1.8 million barrels per day. Strategic petroleum reserves are released at